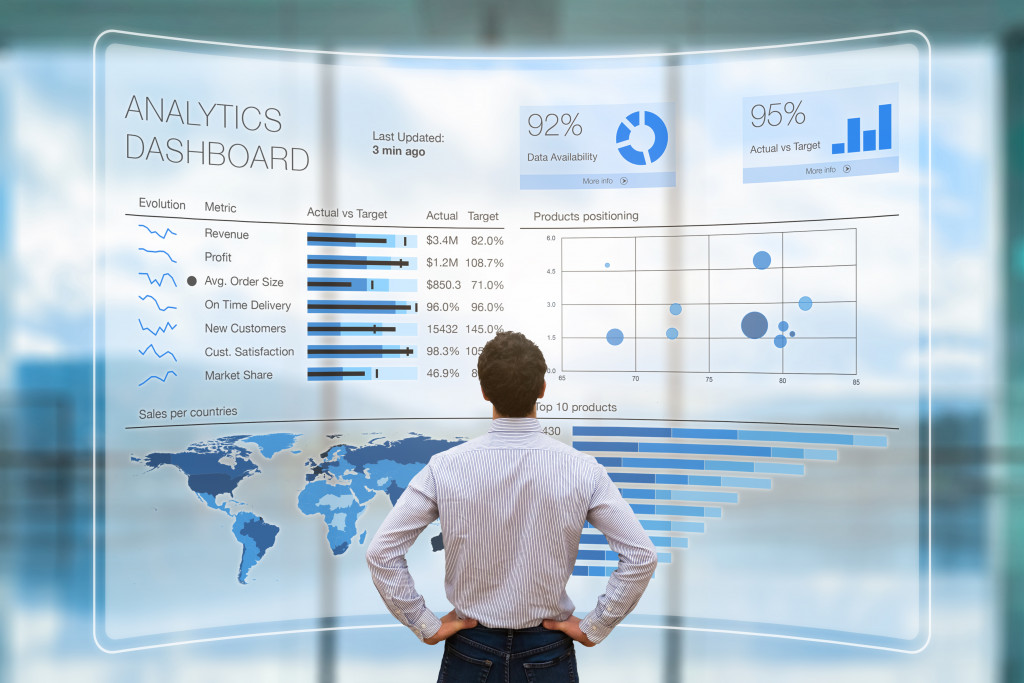
A lot of what is going on in this world relies on numbers and data. Science, business, politics, and others turn to statistics and figures to give them an idea of what is happening right now and what the future looks like. There is a lot of stuff that you have to gather and crunch if you want to become a data analyst. If you are indeed pursuing that career, you must learn a few things first. Do not think about SQL server performance tuning yet because you will be getting to that later. What you should know are some basics that will serve as your building blocks of learning, and these will slowly give you an idea of what the science behind data analysis is all about.
Basic Programming Logic
When you are dealing with numbers, you are basically working with logic and reason. There would be virtually no gray area when it comes to extracting and manipulating it. If you encounter some discrepancies, you should be able to find what is causing that. You cannot just blame it on the computer having a “mood.”
Crunching data will have you perform mathematical formulas to get a certain statistic. An example would be analyzing the academic performance of all fourth-graders in elementary school. Your raw data would include the name of the sections and students, and then their individual grades. From this small sample, you can gather a lot of data. You can get the average score for each section or the whole fourth grade. From there, you can perform stack ranking. If you want to show the highest scores for each specific subject, you can do that too.
These can all be done by using formulas, which are basically basic programming logic. These are instructions that you can enter into a spreadsheet program. Averaging and sorting are usually built into them, but you can also perform more complex instructions, like nested conditional statements. If you want to dabble into software development, this is a good starting point too.
Trending Data

Being an analyst requires you to have a perceptive mind. You should be able to pick up patterns when you glance at a table of data. This is how you start to study the trending of data, which covers the historical and predictive kinds. You can use what you know happened in the past in order to calculate what could happen in the future. If you need to go back several years, then do it as long as you find a meaningful pattern that you think would be significant in the study.
Pivot Table
Being a data analyst will have you staring at spreadsheets most of the time. There are a lot of ways for you to manipulate data, but one of the most flexible ways to do that is by using a pivot table. This is convenient because it basically presents summaries for a sample like the sums and averages. This is great if you are working on a large data set where it would take forever for you to manipulate should you choose to do it manually.
Data analysis is a complex subject. Once you get the gist of it, everything will just fall into place. If you have the patience to decipher data sets, then it would be a fulfilling career for you.

